What is the Dashboard?
The Dashboard is your central command center for understanding how your brand appears across AI-generated responses. It aggregates data from all your monitored prompts and presents the most important metrics at a glance. Every time AI models like ChatGPT, Perplexity, Gemini, Google AI Mode, Bing Copilot, or Grok respond to a user’s question, your brand may or may not appear in the answer. The Dashboard tracks this over time and gives you a clear picture of your brand’s AI presence.Key metrics
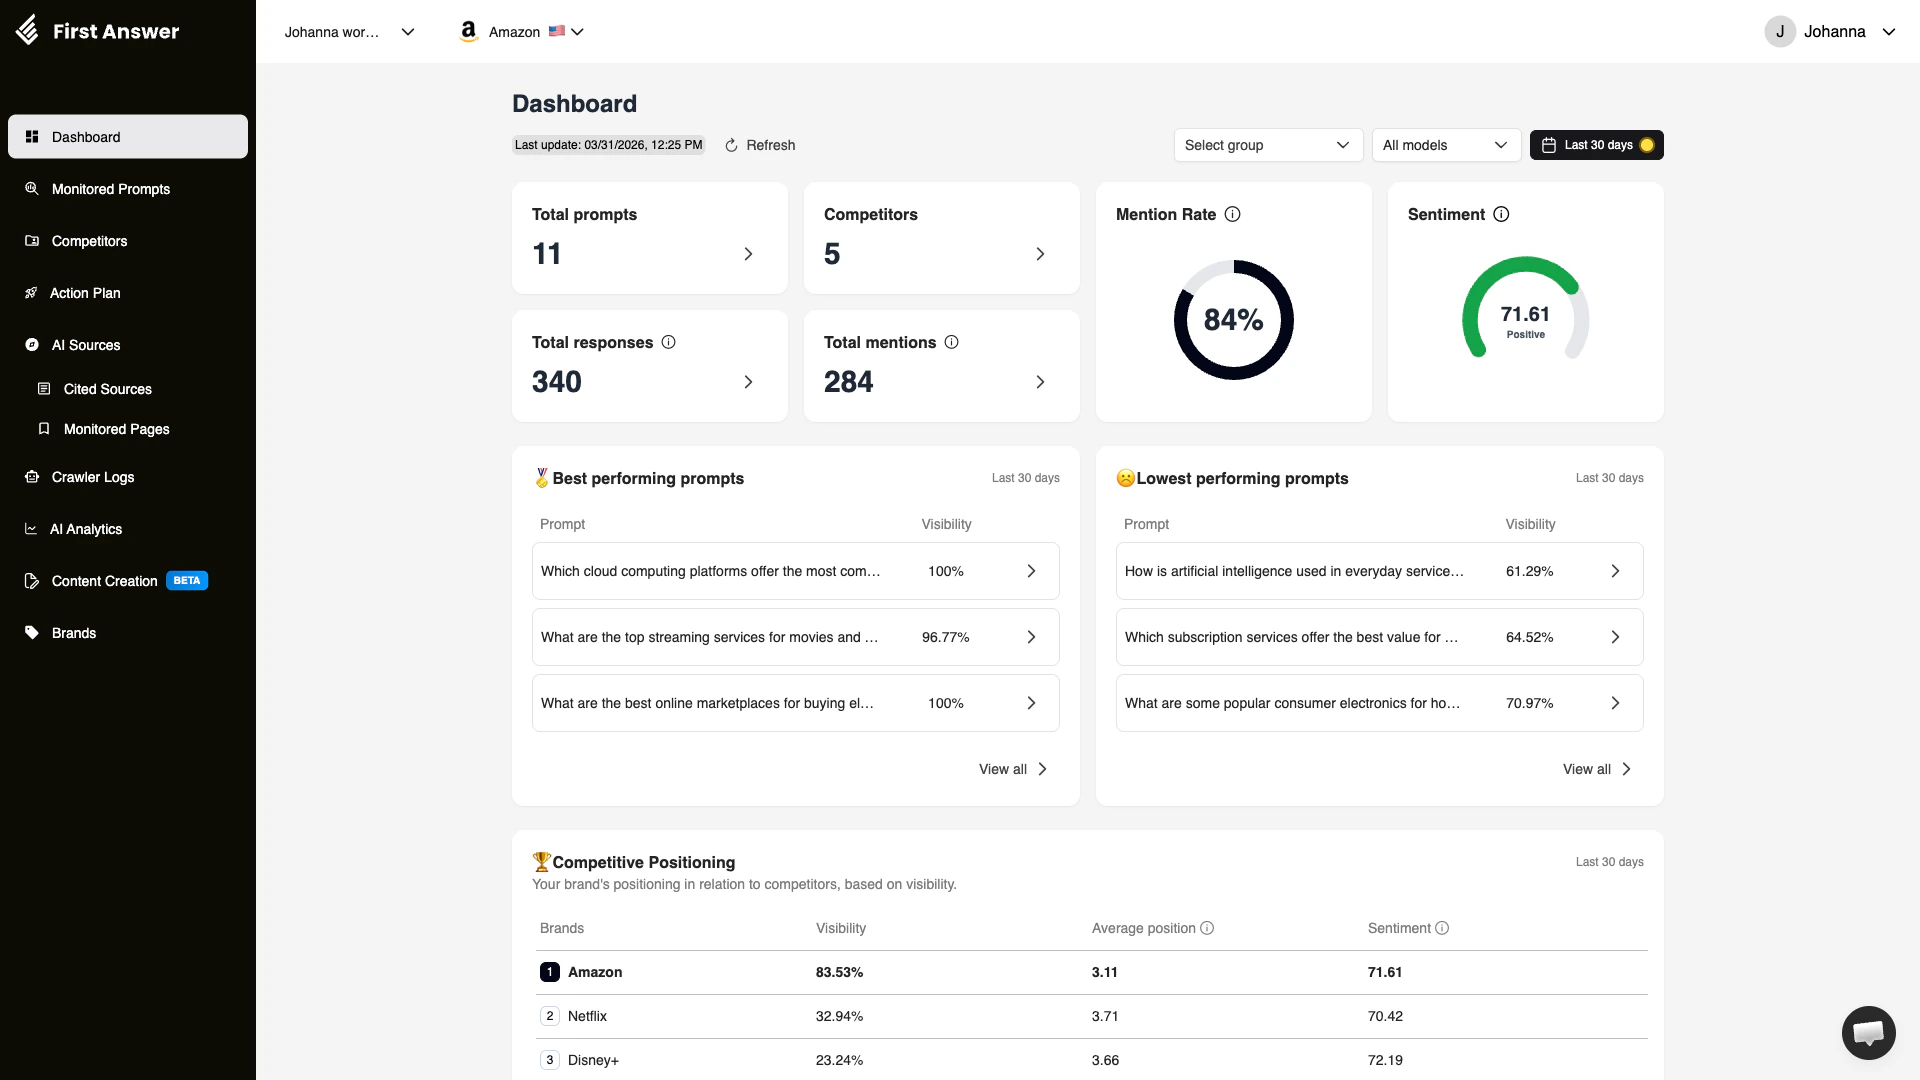
Total prompts
The number of prompts you are actively monitoring across all AI models. Each prompt is a question or query that gets regularly executed against multiple AI platforms to check whether your brand appears in the responses.Competitors
The total number of competitor brands you are tracking. Competitors are other brands whose visibility you want to compare against your own across AI responses.Mention Rate
The percentage of AI responses that mention your brand out of all responses collected. This is one of the most critical metrics — it tells you how often AI models recommend or reference your brand when users ask relevant questions.A low mention rate does not necessarily mean poor performance. It depends on how broad or niche your monitored prompts are. Focus on improving mention rates for prompts that are most relevant to your business.
Total responses
The total number of individual AI-generated responses collected across all models and all monitored prompts. Since each prompt runs against multiple AI models, the total response count is typically much higher than the prompt count.Total mentions
How many times your brand was specifically mentioned across all collected responses. A single response may mention your brand multiple times, but this counts distinct response-level mentions.Sentiment
An aggregate sentiment score for how AI models talk about your brand. The score ranges from 0 to 100:- 0–40: Negative — AI models tend to describe your brand unfavorably
- 40–60: Neutral — mentions are factual without strong positive or negative tone
- 60–100: Positive — AI models describe your brand favorably
Best and lowest performing prompts
The Dashboard highlights your top 3 best performing and top 3 lowest performing prompts based on visibility score. This helps you quickly identify:- Best performing: Prompts where your brand consistently appears in AI responses with high visibility. These represent your strengths.
- Lowest performing: Prompts where your brand rarely or never appears. These are opportunities for improvement through content optimization, SEO for AI, or content creation.
Competitive Positioning
The bottom section of the Dashboard shows a competitive ranking table that compares your brand against all tracked competitors. For each brand, you can see:- Visibility: The percentage of responses where the brand appears
- Average position: Where the brand typically appears in ranked lists within AI responses (lower is better)
- Sentiment: How positively or negatively the AI talks about each brand
Filters
You can refine the Dashboard view using:- Date range: Focus on a specific time period (default is last 30 days)
- Group: Filter by prompt groups if you organize your prompts into categories
- AI model: View data from a specific AI model only (e.g., ChatGPT, Perplexity, Gemini)
How to use the Dashboard
Review your mention rate
Start by checking your overall mention rate. If it is below your target, navigate to the lowest performing prompts to understand where you are missing.
Check sentiment
A neutral or positive sentiment is healthy. If sentiment drops, investigate which prompts or responses are driving negative language about your brand.
Compare against competitors
Scroll to the Competitive Positioning section. Identify competitors with higher visibility and analyze what they are doing differently.
Drill into prompts
Click “View all” on either the best or lowest performing prompts section to navigate to the full Monitored Prompts page for deeper analysis.